https://computingforgeeks.com/deploy-kubernetes-cluster-on-ubuntu-with-kubeadm/
Install Kubernetes Cluster on Ubuntu 20.04 with kubeadm | ComputingForGeeks
Kubernetes is a tool for orchestrating and managing containerized applications at scale on on-premise server or across hybrid cloud environments. Kubeadm is a
computingforgeeks.com
Kubernetes Dashboard
https://computingforgeeks.com/how-to-install-kubernetes-dashboard-with-nodeport/
How To Install Kubernetes Dashboard with NodePort | ComputingForGeeks
Kubernetes dashboard is a web-based user interface which provides information on the state of the Kubernetes cluster resources and any errors that may occur.
computingforgeeks.com
- Kubernetes Dashboard 배포
- 클러스터에 바로 배포
>> kubectl apply -f https://raw.githubusercontent.com/kubernetes/dashboard/master/aio/deploy/recommended.yaml
- 클러스터에 바로 배포
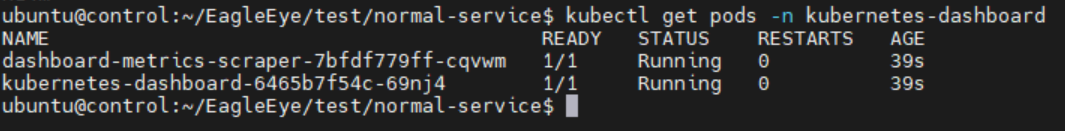
- 외부로 포트 열기
>> kubectl --namespace kubernetes-dashboard patch svc kubernetes-dashboard -p '{"spec": {"type": "NodePort"}}' - 열린 포트 확인
>> kubectl get svc -n kubernetes-dashboard kubernetes-dashboard -o yaml
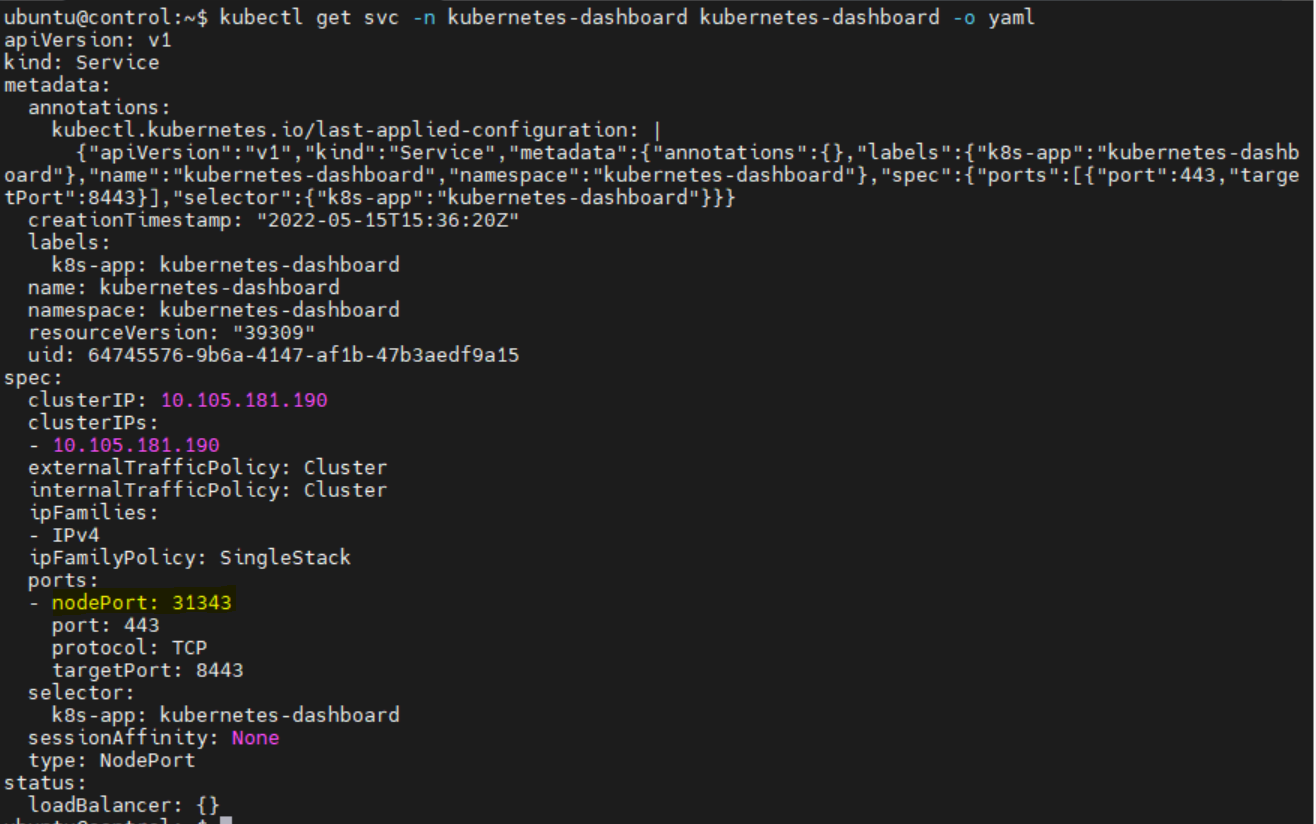
- 지정한 포트로 바꾸기
>> vi nodeport_dashboard_patch.yaml
- 아래 내용 작성 (32000 포트로 변경)
spec:
ports:
- nodePort: 32000
port: 443
protocol: TCP
targetPort: 8443
- 포트 변경 적용
>> kubectl -n kubernetes-dashboard patch svc kubernetes-dashboard --patch "$(cat nodeport_dashboard_patch.yaml)"

- 접속하기
>> https://{도메인}:32000
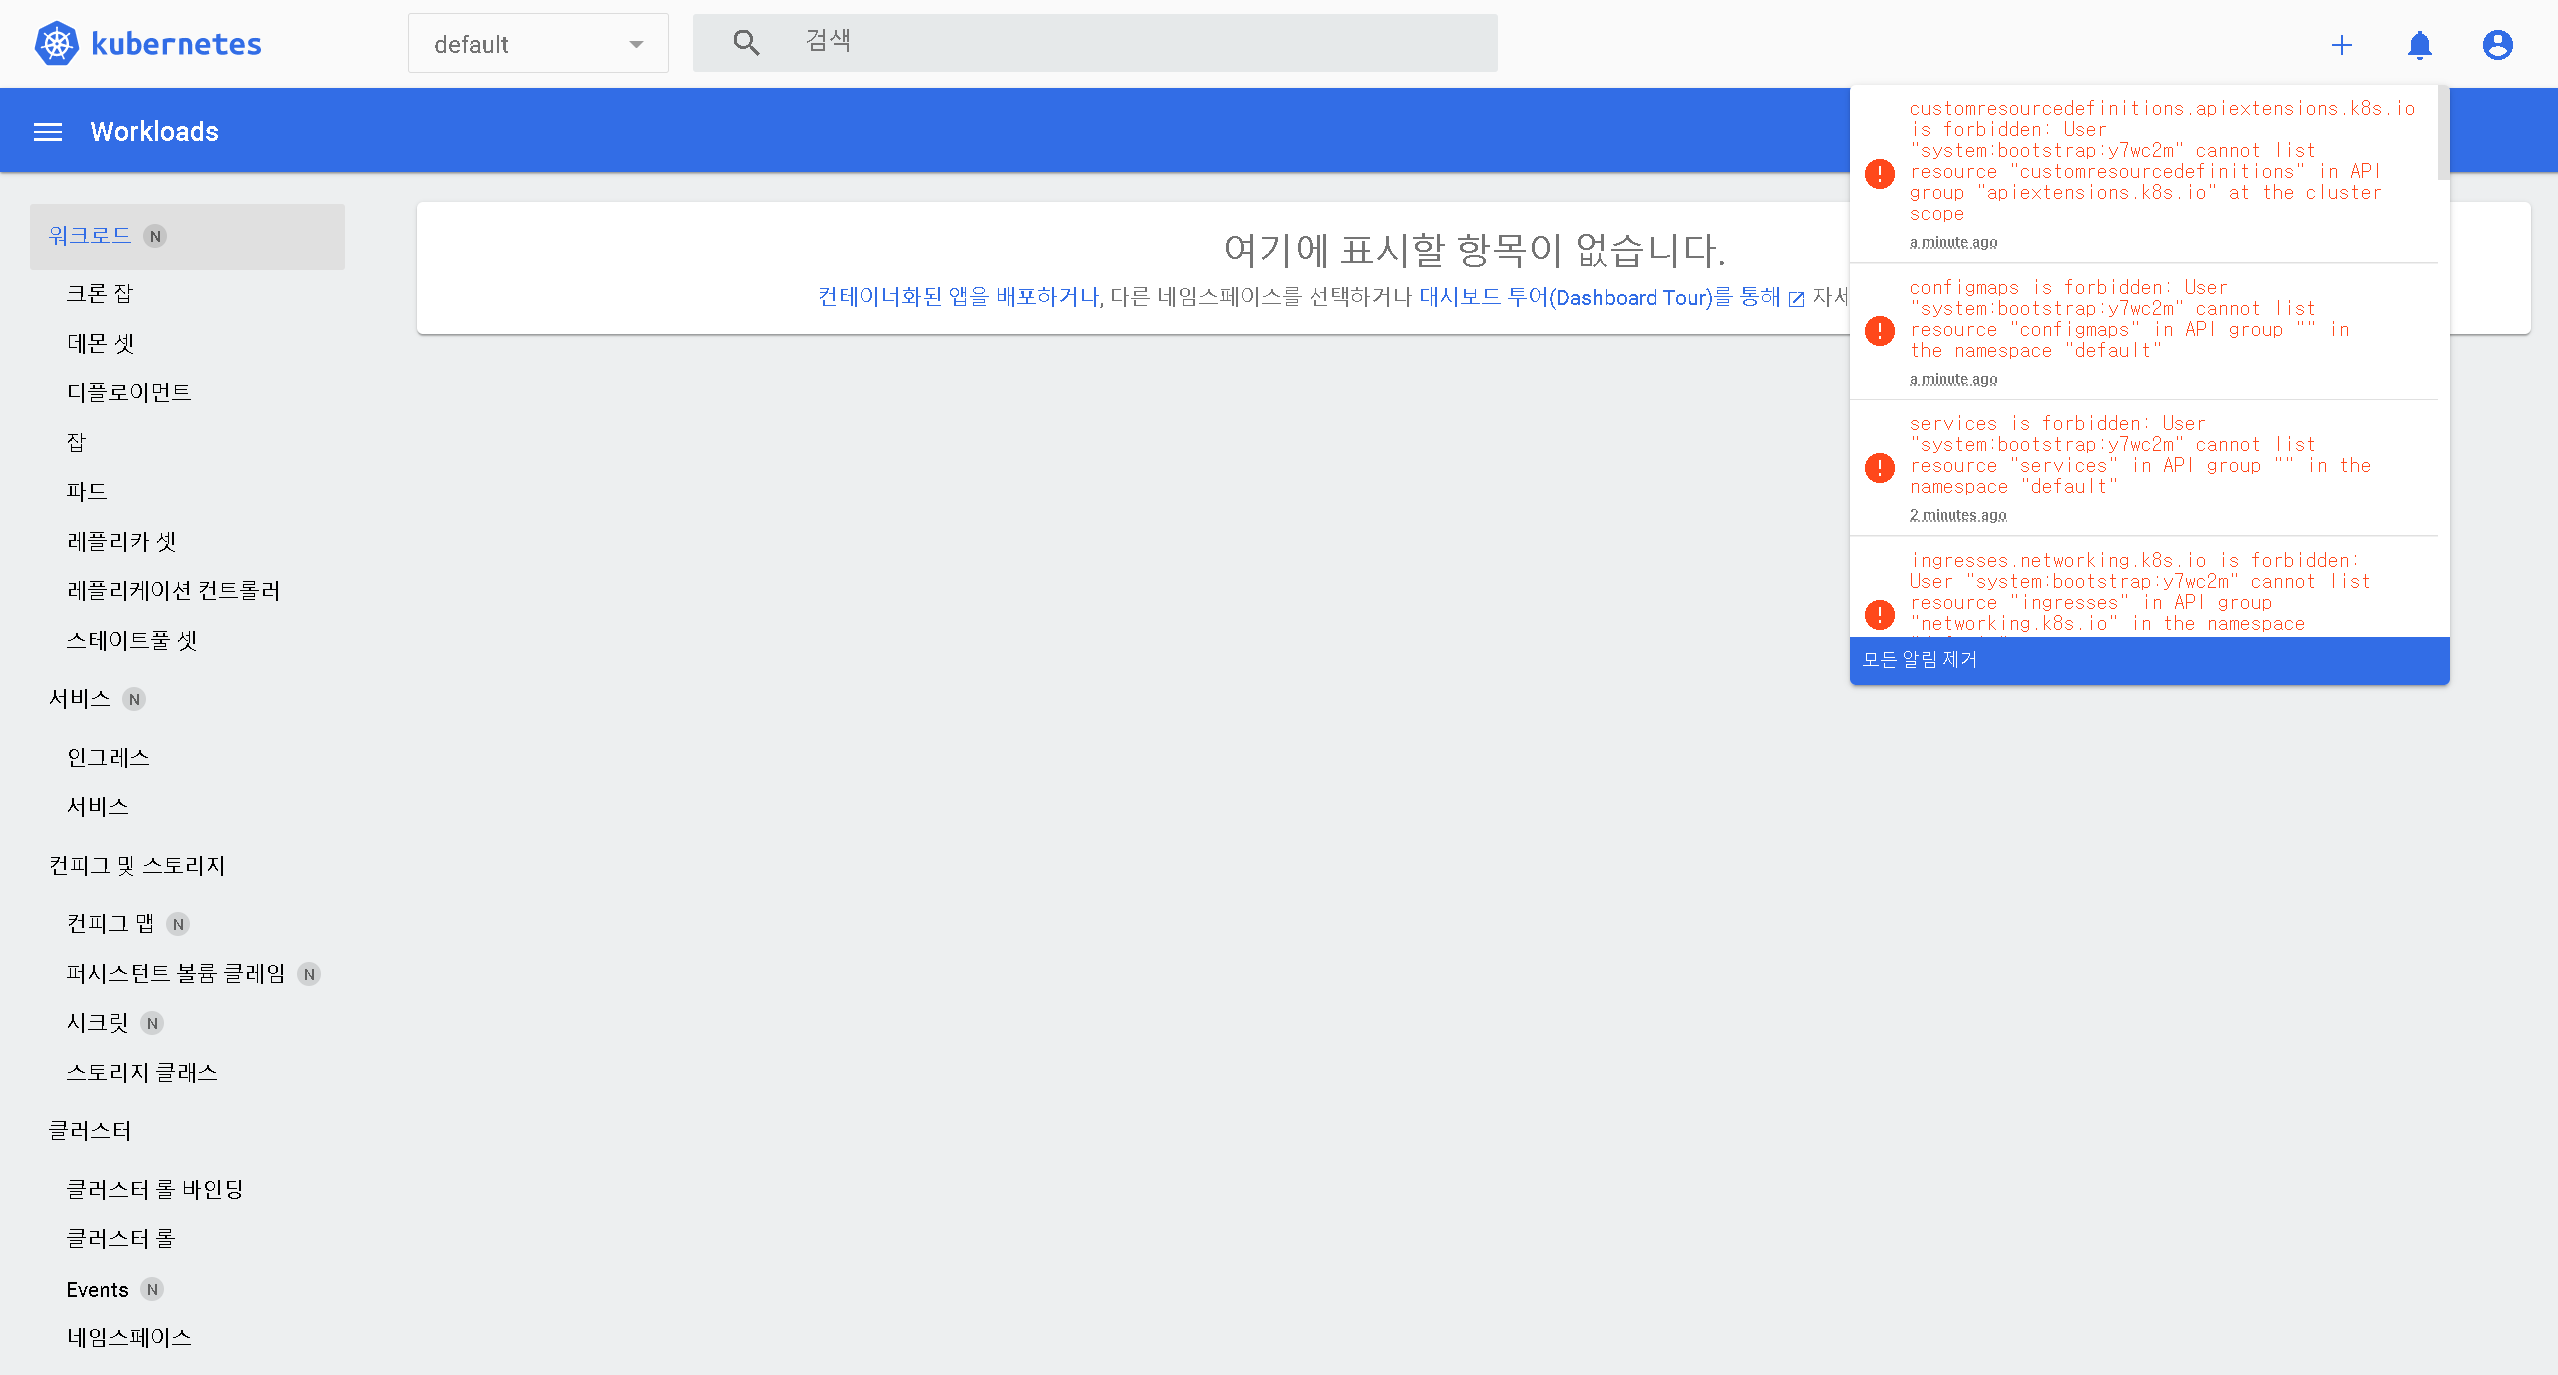
- [에러] 접속은 되지만 표시되는 내용이 없음
-> api group을 설정해야하는 것 같다 (일단 보류)
Metric Server
https://computingforgeeks.com/how-to-deploy-metrics-server-to-kubernetes-cluster/
Install Metrics Server on a Kubernetes Cluster | ComputingForGeeks
The Kubernetes Metrics Server is a cluster-wide aggregator of resource usage data. Its work is to collect metrics from the Summary API, exposed by Kubelet on
computingforgeeks.com
- manifest 파일 다운로드
>> wget https://github.com/kubernetes-sigs/metrics-server/releases/latest/download/components.yaml -O metrics-server-components.yaml - 배포
>> kubectl apply -f metrics-server-components.yaml - [에러] 상태 확인
>> kubectl get pods -n kube-system
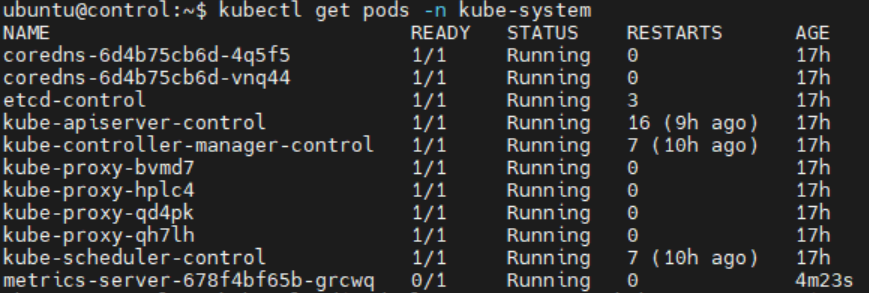

- 정상 동작을 하지 않음
- Readiness probe failed: HTTP probe failed with statuscode: 500
https://developer-kus.tistory.com/46
kubenetes #4 - 메트릭 서버 설치하기(install metrics-server)
목차 1. Metrics Server 란? 2. Metrics Server 설치하기 2.1 다운로드 2.2 TLS 수정 2.3 동작확인 1. Metrics Server 란? 메트릭 서버는 클러스터 전체의 리소스 사용 데이터를 수집한다. 각 노드에 설치되어있는..
developer-kus.tistory.com
- [해결] kubelet 옵션 추가
>> kubectl edit deployments.apps -n kube-system metrics-server
- --kubelet-insecure-tls 추가
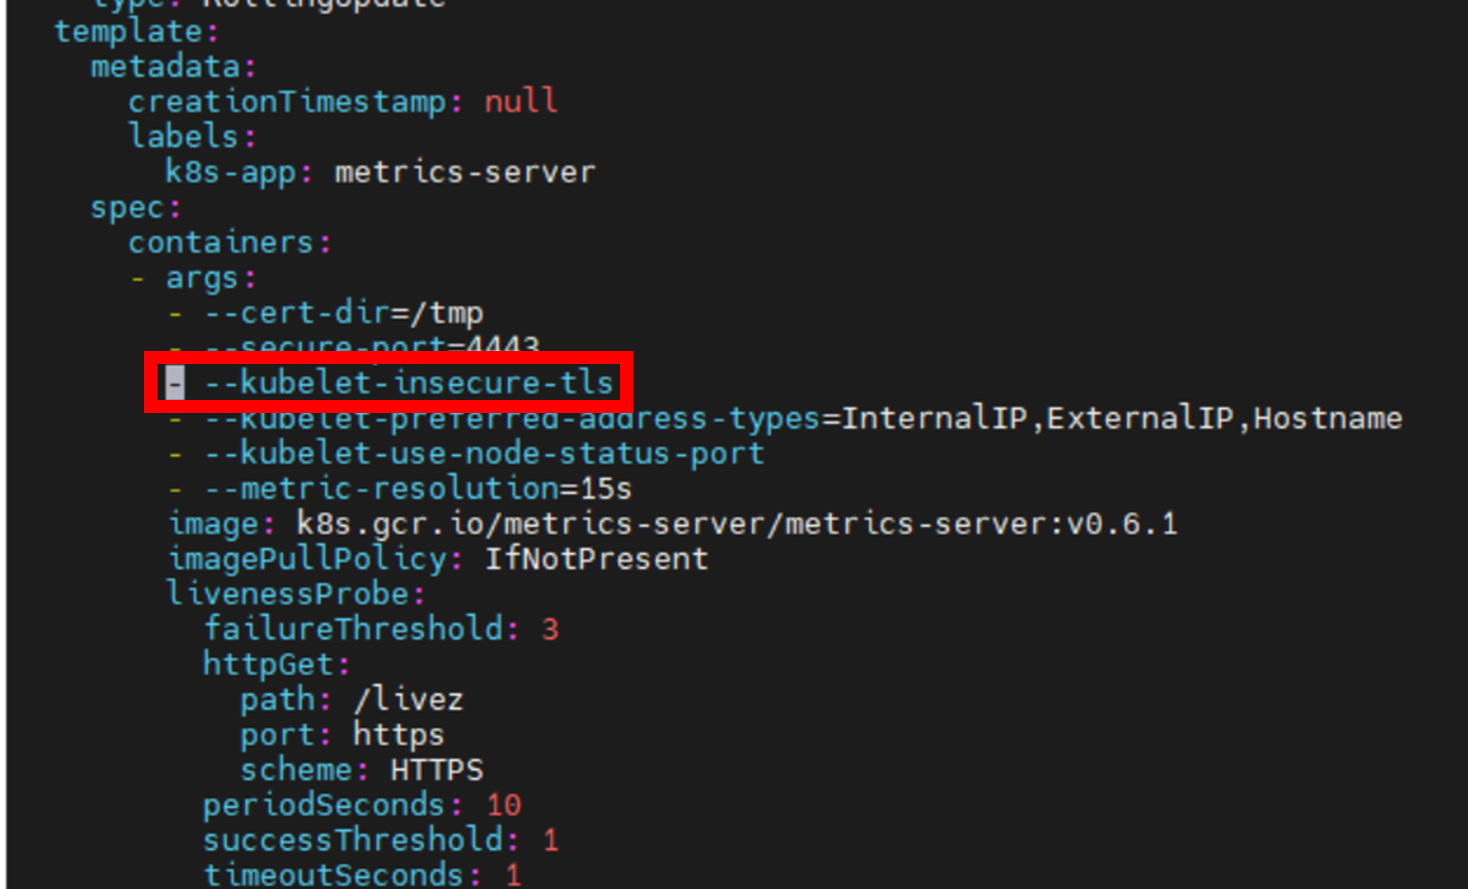
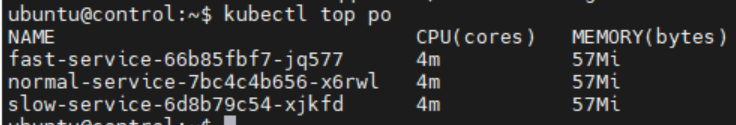
- 정상동작 확인
>> kubectl top po
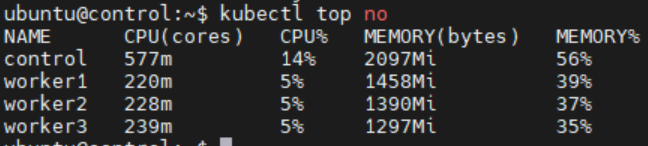
>> kubectl top no
[실패] Prometheus and Grafana
https://computingforgeeks.com/setup-prometheus-and-grafana-on-kubernetes/
Setup Prometheus and Grafana on Kubernetes using prometheus-operator | ComputingForGeeks
Monitoring Production Kubernetes Cluster(s) is an important and progressive operation for any Cluster Administrator. There are myriad of solutions that fall
computingforgeeks.com
Prometheus / Grafana 설명
- Prometheus
- 고급 metric에 접근할 수 있도록 해주는 full fledged solution
- 30초마다 metric 수집 (default)
- Memory
- CPU
- Disk Performance
- Network IO
- R/W rates - 14일동안 클러스터에 노출 (default)
- Grafana
- Prometheus 데이터베이스에 수집/저장되는 metric의 분석/대화형 시각화에 사용
- k8s 클러스터에 대한 커스텀 차트/그래프/알람 생성 가능
- Prometheus Opertor
- k8s에 Prometheus 모니터링 스택 deploy하기 위해 사용
- deployment 쉽게, Prometheus와 이에 관련된 모든 모니터링 컴포넌트의 전체적인 관리를 편하게 하기 위해 작성
- Operator를 활용하여 Prometheus 설정을 간편하게하고 자동화함
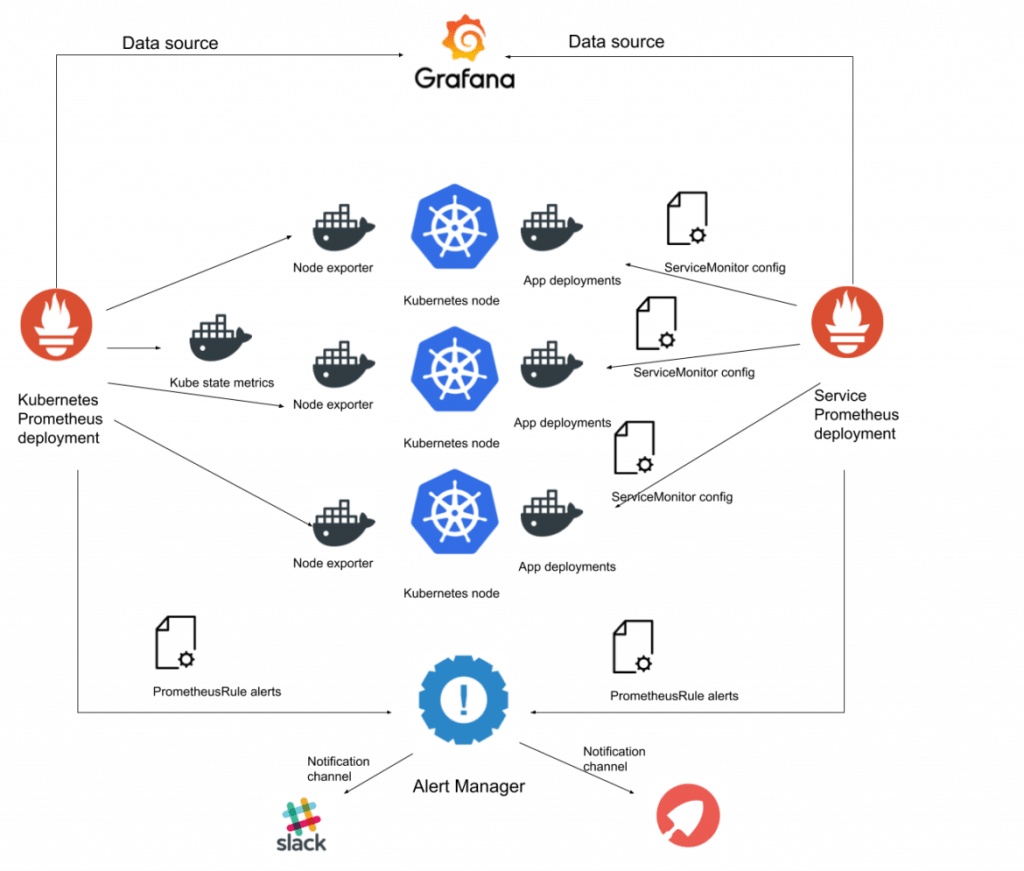
- Operator는 Prometheus 모니터링 스택을 배포/설정하기위해 다음 custom resource definitions(CRDs)을 사용
- Prometheus
- k8s에서 원하는 Prometheus deployment를 정의 - Alertmanager
- k8s 클러스터에서 원하는 Alertmanager deployment를 정의 - ThanosRuler
- 원하는 Ruler deployment를 정의 - ServiceMonitor
- k8s service의 그룹이 어떻게 monitor되야하는지 명시 - PodMonitor
- k8s pod의 그룹이 어떻게 monitor되야하는지 선언적으로 명시 - Probe
- static target 또는 ingress의 그룹이 어떻게 monitor되야하는지 명시 - PrometheusRule
- Prometheus 알람의 spec 제공
- Operator는 Prometheus 인스턴스로 사용될 rule file을 생성 - AlertmanagerConfig
- Alertmanager 설정의 subsection을 선언적으로 명시
- 이는 custom receiver에 대한 알람을 routing
- 금지 rule을 설정
- Prometheus
Prometheus / Grafana 모니터링 스택 k8s에 배포
kube-prometheus 프로젝트 사용- Prometheus Operator를 포함함- cluster monitoring 목적- 모든 k8s 컴포넌트로부터 metric 수집
kube-prometheus clone해오기>> git clone https://github.com/prometheus-operator/kube-prometheus.git>> cd kube-prometheus
https://github.com/prometheus-operator/kube-prometheus
GitHub - prometheus-operator/kube-prometheus: Use Prometheus to monitor Kubernetes and applications running on Kubernetes
Use Prometheus to monitor Kubernetes and applications running on Kubernetes - GitHub - prometheus-operator/kube-prometheus: Use Prometheus to monitor Kubernetes and applications running on Kubernetes
github.com
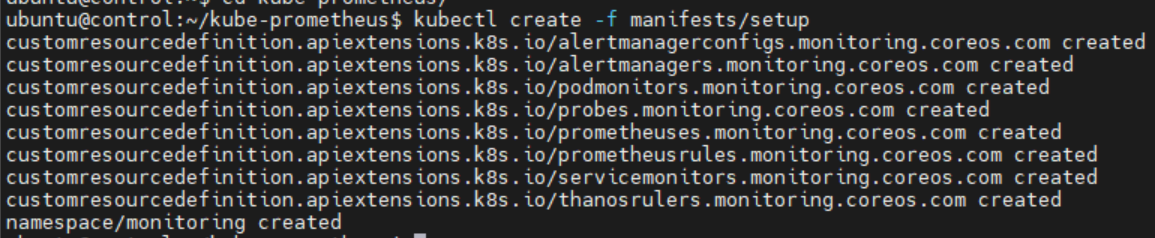
monitoring Namespace 생성 및 CustomResourceDefinitions & operator pod 생성>> kubectl apply --server-side -f manifests/setup>> kubectl apply -f manifests/
pods 확인>> kubect get pods -n monitoring

NodePort 설정
Prometheus>> kubectl --namespace monitoring patch svc prometheus-k8s -p '{"spec": {"type": "NodePort"}}'Alertmanager>> kubectl --namespace monitoring patch svc alertmanager-main -p '{"spec": {"type": "NodePort"}}'Grafana>> kubectl --namespace monitoring patch svc grafana -p '{"spec": {"type": "NodePort"}}'확인>> kubectl -n monitoring get svc | grep NodePort

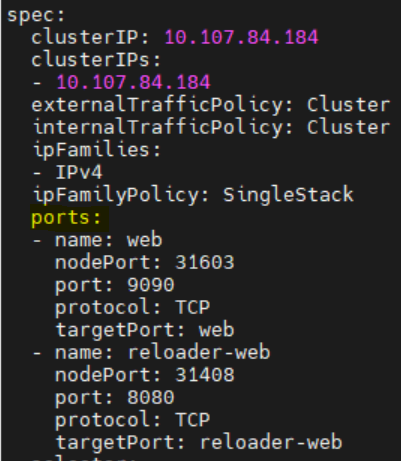
지정 포트로 바꾸기(Prometheus)>> kubectl get svc -n monitoring prometheus-k8s -o yaml>> vi nodeport_prometheus_patch.yaml- ports: 부분 복사해서 nodePort만 수정 (port 32001)>> kubectl -n monitoring patch svc prometheus-k8s --patch "$(cat nodeport_prometheus_patch.yaml)"
지정 포트로 바꾸기(Alertmanager)>> kubectl get svc -n monitoring alertmanager-main -o yaml>> vi nodeport_alertmanager_patch.yaml- ports: 부분 복사해서 nodePort만 수정 (port 32002)>> kubectl -n monitoring patch svc alertmanager-main --patch "$(cat nodeport_alertmanager_patch.yaml)"지정 포트로 바꾸기(Grafana)>> kubectl get svc -n monitoring grafana -o yaml>> vi nodeport_grafana_patch.yaml- ports: 부분 복사해서 nodePort만 수정 (port 32003)>> kubectl -n monitoring patch svc grafana --patch "$(cat nodeport_grafana_patch.yaml)"필요시 포트포워딩 추가- 32001, 32002, 32003
접속 확인- local에서 port-forward를 활용하여 curl을 날려보면 접속이 되지만
- 포드포워딩 + NodePort로 열어서 접속시 timeout (localhost로 nodeport에 날려도 안됨)
- 훗날 원인 확인을 위해 기록 유지 -> 다른 방식으로 다시 설치해볼 예정
'만들기 > EagleEye' 카테고리의 다른 글
| [EagleEye][환경세팅] Kubernetes Prometheus-stack 설치 (0) | 2022.05.17 |
|---|---|
| [EagleEye][환경세팅] Helm 설치 (0) | 2022.05.16 |
| [EagleEye][서비스구현] K8s 클러스터 애플리케이션에 접속하기 (0) | 2022.05.15 |
| [EagleEye][서비스구현] Spring boot with K8s (0) | 2022.05.15 |
| [EagleEye][환경세팅] 쿠버네티스 설치 3 - 워커노드 세팅 (0) | 2022.05.14 |